
Digital Marketing Statistics, Trends and Data To Keep in Mind in 2026
1. Online marketing strategy statistics
2. eCommerce statistics
3. Social media marketing statistics
4. Search engine statistics
5. Mobile marketing statistics
6. Content marketing statistics
7. Email marketing statistics
What do you need to plan a successful digital marketing strategy? Right - it is necessary to obtain knowledge of the current trends and best practices. It is the best way to approach any task: rather than making bold guesses, you can base each of your decisions on reliable data.
We decided to make this task easier for you and collected all the essential digital marketing statistics in one place. This way, you can have all the necessary information to use in your marketing efforts in one place. Let’s start!
Online marketing strategy statistics
First things first, let’s start with some general digital marketing stats to have a bigger picture in mind, and later we can move on to different aspects of it.
- Please, plan your strategy! The research shows that businesses that plan their digital marketing strategy are 356% more likely to succeed than those that do not take care of their online presence. Many companies support that level of strategic discipline with frameworks like The EOS Process, which helps teams turn long-term goals into clear priorities and execution.
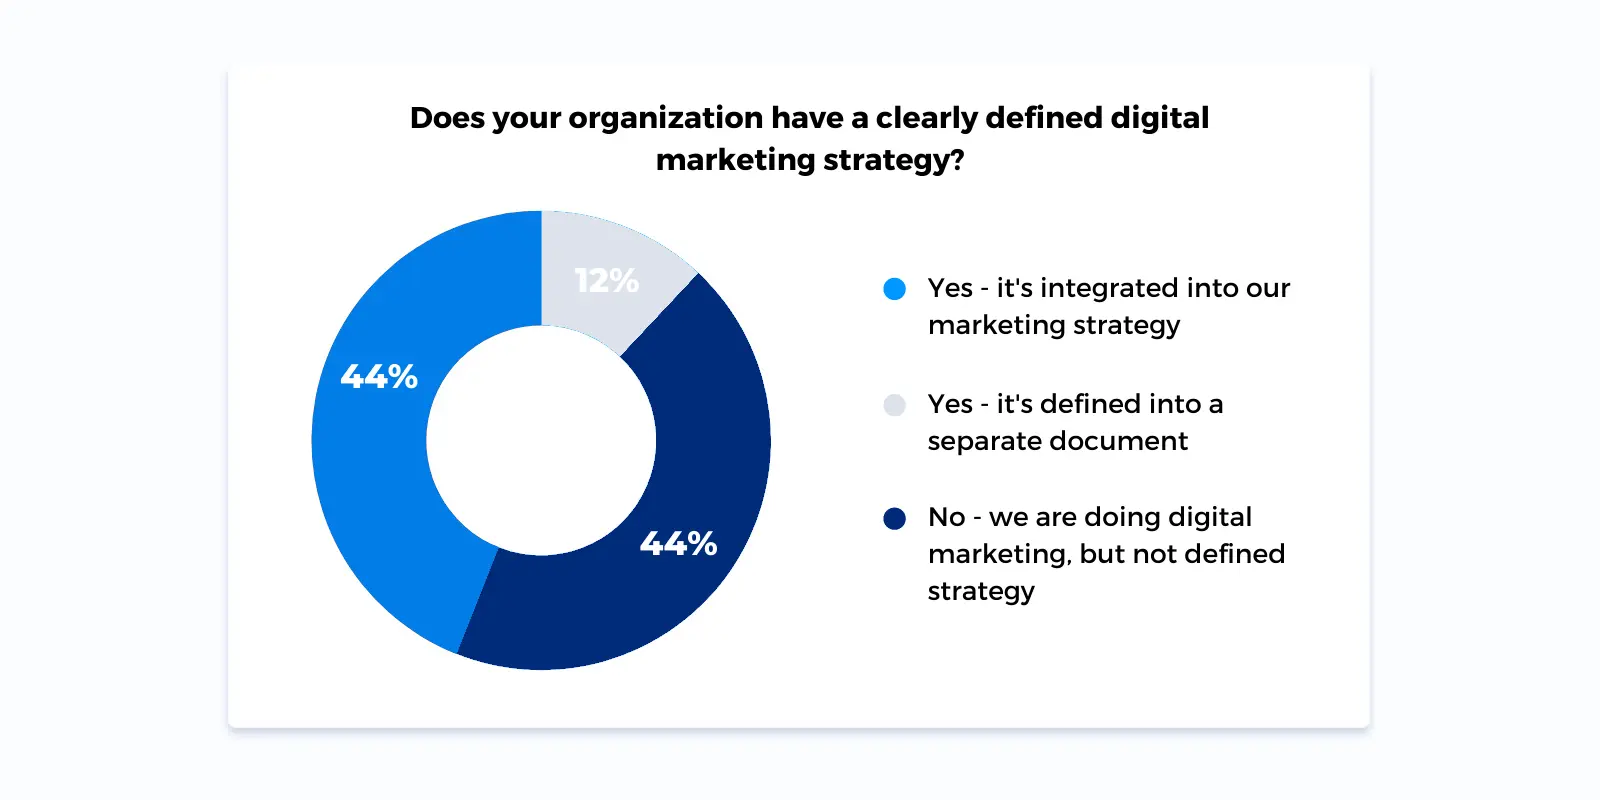
- Unfortunately, almost half (45%) of the organizations don’t have a defined marketing strategy. That’s a big mistake: as we can see from the previous fact, a proper digital marketing strategy can bring a company colossal success.
- One more aspect of digital marketing strategy to pay attention to is A/B testing. 49% of companies are currently using this method to find out more about their customers’ journeys.
- 36% of marketers are now actively implementing both digital and traditional marketing strategies. So, if you are only starting out with your marketing planning, you are not alone!
- What are the most used digital marketing tools to help businesses be more effective with their strategies? The top three ones are CRM (customer relationship management), marketing automation, and website visitor intelligence technologies.
- Between 2020 and 2021, one could observe a 13% increase in budget for digital marketing campaigns. More and more companies are investing in their online presence!
- Visual content strategy should be an integral part of your digital marketing campaign. 74% of surveyed marketers reported using visuals in their materials more than 70% of the time. It is easy to understand why: visuals never fail to catch one’s eye and encourage us to read more.
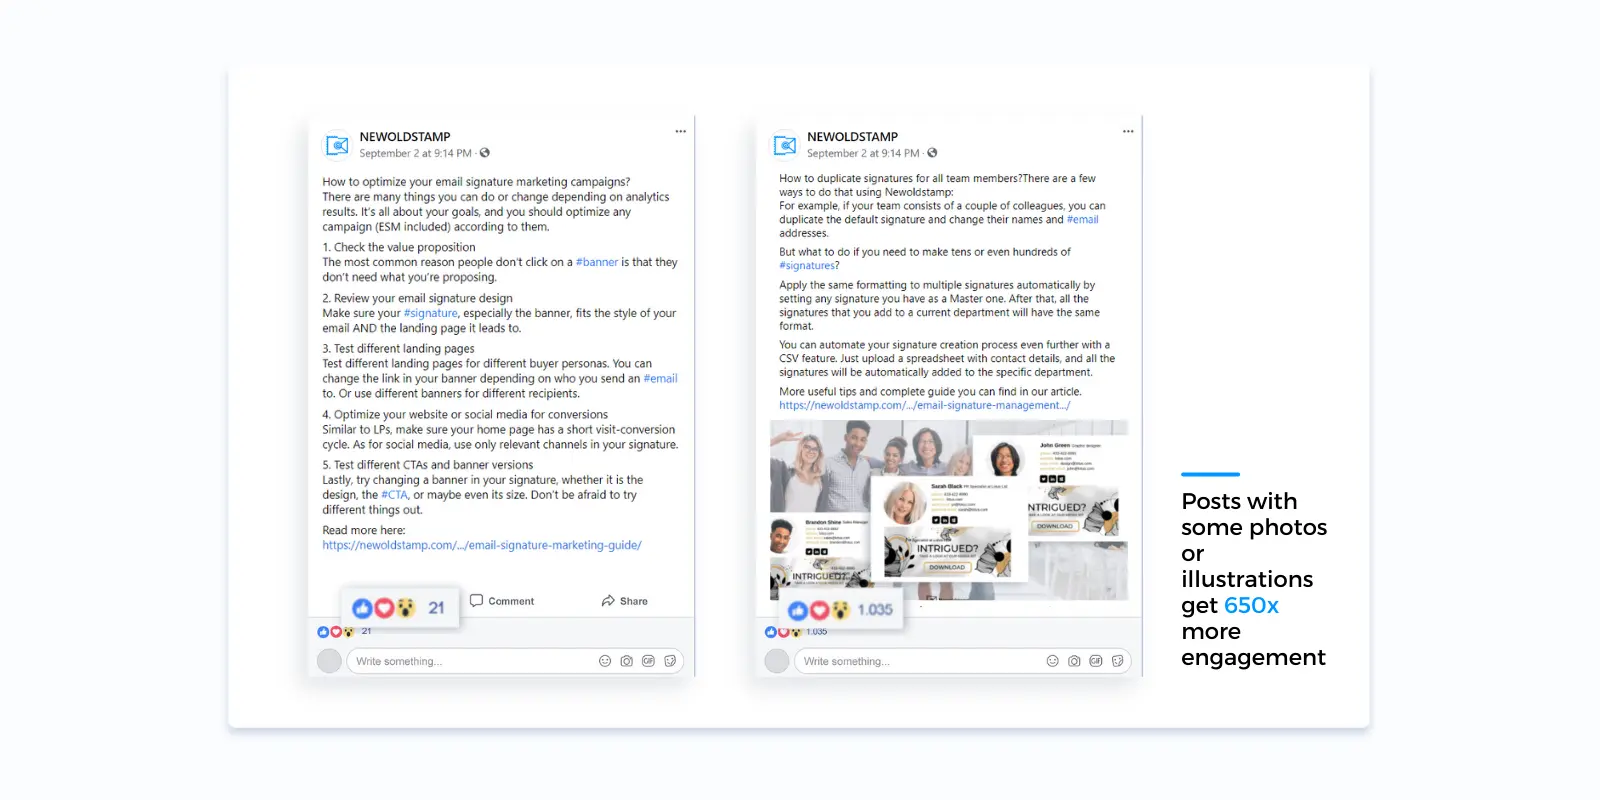
- It is no surprise that marketers care so much about their visual materials. On average, posts with some photos or illustrations, or visual inspiration get 650x more engagement than those containing text only.
- Are you thinking about investing in a landing page or two? Do it! Companies with around 40 landing pages or more typically generate 12 times more leads than the companies with 1 to 5 of such websites. Still, even one landing page is better than none at all, right?
- And last but not least, use some video content! Data shows that using videos of your products can increase purchases by 144%. Incredible!
eCommerce statistics
- Let’s start discussing online shopping by analyzing how customers find the products to buy. Recent research shows that 43% of online shoppers look up products via social networks. We will discuss social media in more detail later on, but as for now, it is clear that social network presence is a must for any business.
- What do we buy online most often? Clothes. 59% of online purchases in the US are clothing items. Some popular categories also include books, electronics, shoes, and movies.
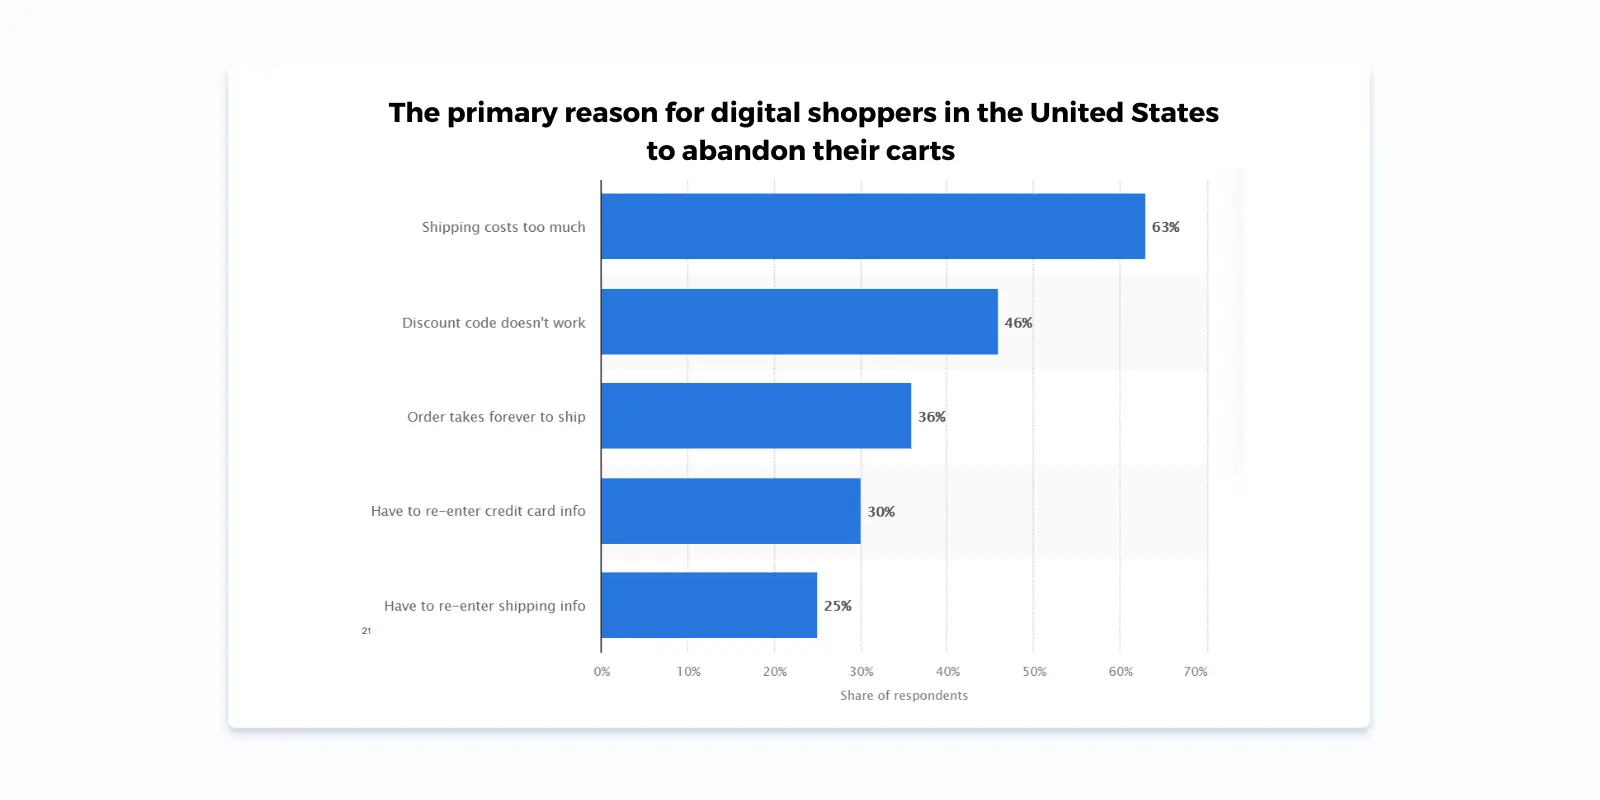
- What are the main obstacles in online shopping? Most customers reported that high shipping cost is why they abandon their carts and don’t make the purchase after all. As a business owner, you might consider free shipping in some cases to attract more customers.
- This statement is supported by one more fact: 79% of US shoppers say that free shipping would encourage them to shop online more.
- eCommerce is already getting a more significant share due to the pandemics and offline shopping restrictions. And it will remain this way for a long time: it is predicted that eCommerce will take up 24% of global retail sales by 2025.
- 22% doesn’t seem too much? Actually, eCommerce accounts for around 11% right now, which is considered quite a high number.
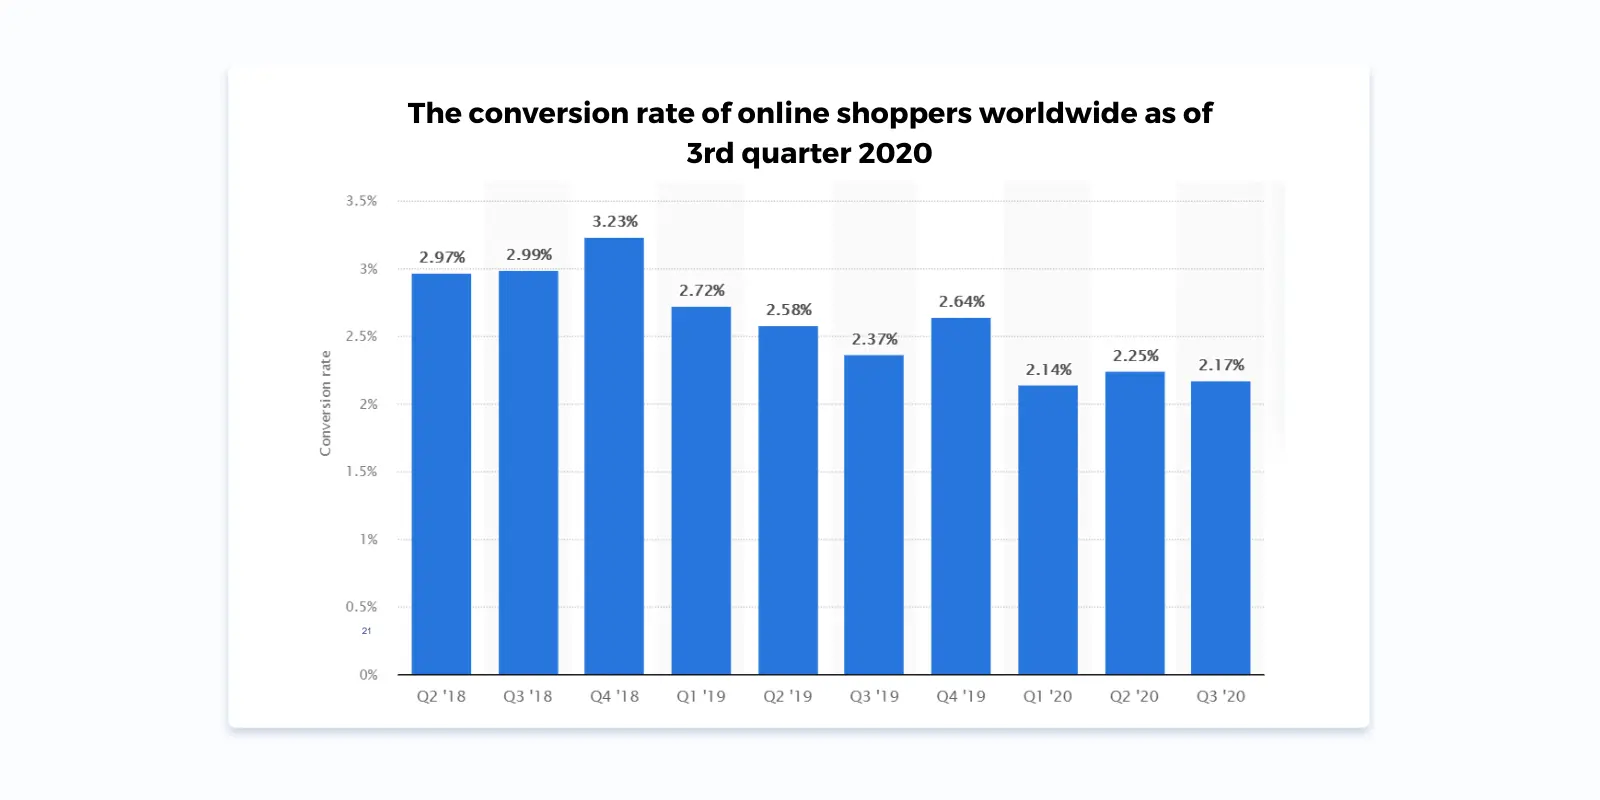
- What about the conversion rates? As for B2B commerce, the rates are between 2,7-3,2%.
- How do your customers prefer to pay for the product? PayPal is the leader in the US, with 89% of customers using this service. So, don’t forget to give your clients the possibility to use PayPal as a payment method along with a credit card. Understanding your customers’ payment behavior is as important as knowing how loans affect credit rating, since both can influence their financial decisions.
- Can you imagine that around half of the American small businesses don’t own a website? It is an unbelievably high number considering that offline shopping has not been particularly possible in the last couple of months.
- Wondering how to make the shopping process more convenient for your customers? Think about live chats. They are easy to get, and around half of the consumers say that they prefer to chat online with the company representative rather than call them.
Social media marketing statistics
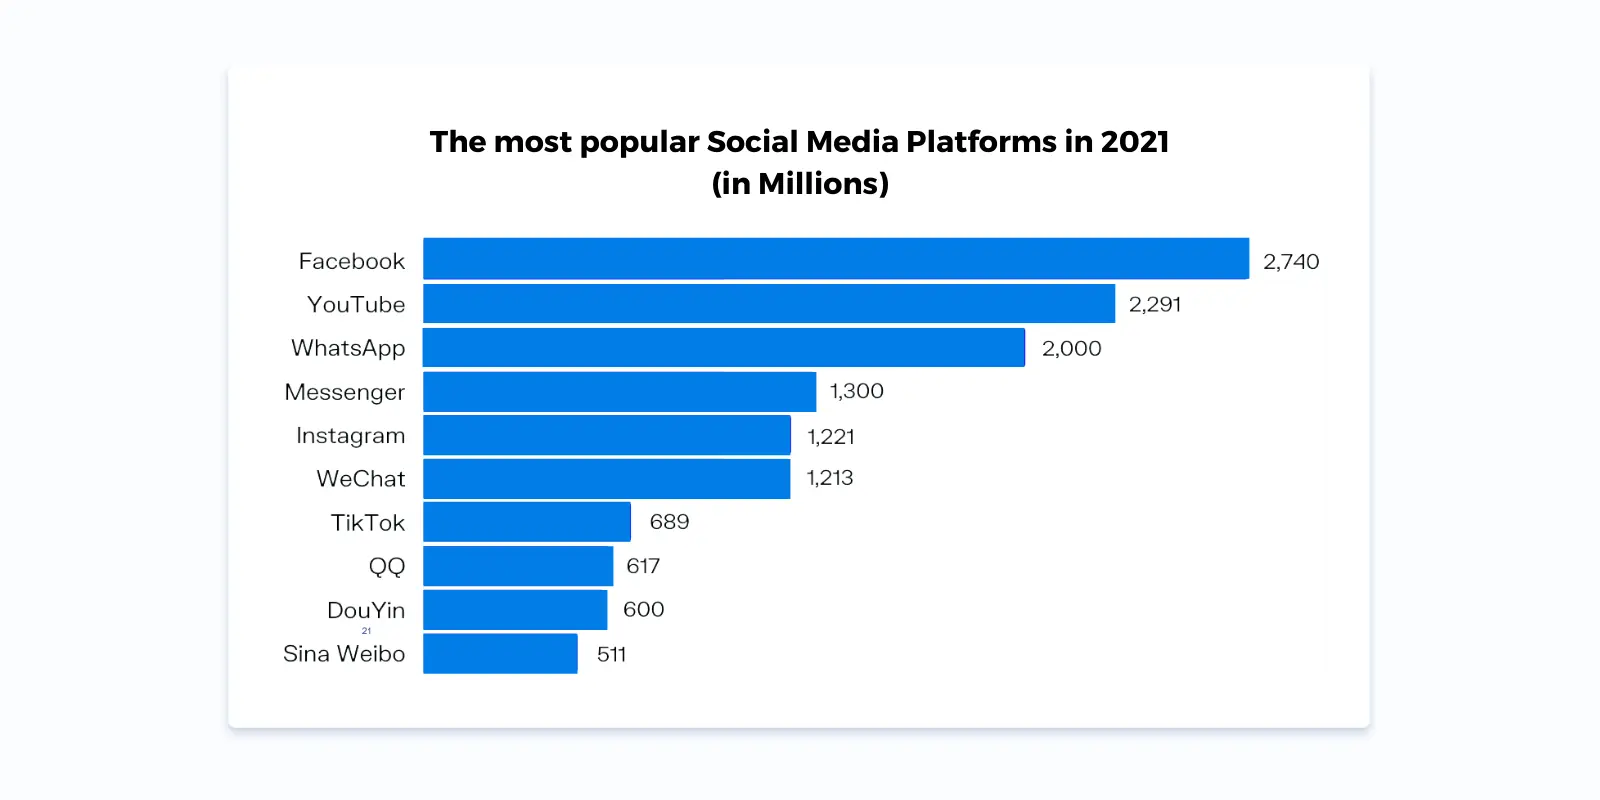
- Let’s now discuss social media statistics. If you don’t have an Instagram or LinkedIn account for your brand, many potential clients might never discover your products. As for the preferred platforms, Facebook remains a top choice for most social media users, followed by Instagram and Twitter.
- While more people prefer Facebook, Instagram has much higher engagement rates. Instagram’s average engagement rate is 1,22% when Facebook’s is only 0,09%! So, it would be wise to target both platforms for the best results.
- But how effective social network marketing is in general? Well, 73% of marketers believe that there is an excellent reason to use social media platforms for promotion and call them somewhat or very effective for marketing purposes.
- What if you run a B2B business? In this case, you might turn away from Facebook and Instagram and choose LinkedIn instead. 96% of B2B marketers use this social media platform for organic content distribution. According to the Content Marketing Statistics Survey, 24% of businesses focus on social media marketing for their 2025 content marketing efforts.
- If you decide to go with Facebook as your central promotion platform, don’t forget to link your posts back to your website, as links are the most common type of brand content posted there. 44, 2% of all Facebook brand posts contain a link!
- What about Facebook ads? On average, a Facebook user clicks on 11 ads per month.
- As for content preferences, 58% of social network users state that they like seeing visual content more than anything else. That’s why you should never forget to add a nice picture to your post.
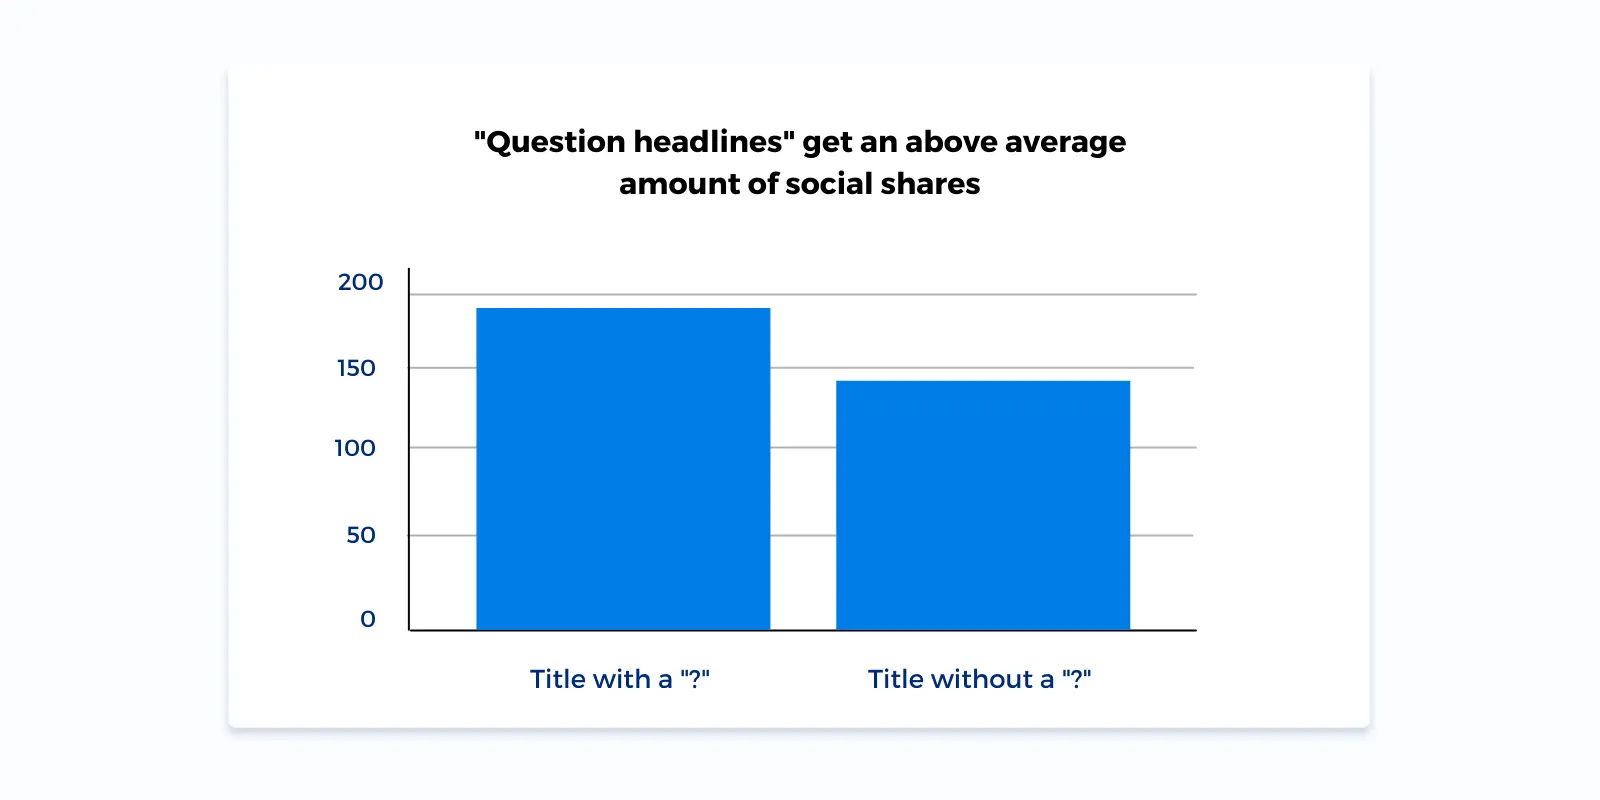
- Now, it is clear that you should add some visual materials to each of your social media posts. But what about the texts themselves? A recent study demonstrates that headliners with a question in them receive 23, 3% more social shares than without a question mark. So try to ask your followers a question: they will like it!
- 44,8 % of Internet users reported that they utilize social media to search for some brand information. This data once again highlights how crucial it is to represent your business on social media and make sure that you have all the updated information there, such as prices or customer reviews.
- Let’s finish the social networks statistics discussion with one more huge platform: YouTube. In their recent report, the platform owners shared that 70% of people say that they bought from a brand after seeing it on YouTube. Consider this a great opportunity to boost growth by implementing a YouTube marketing strategy. While creating an ad video for this platform might be a bit pricey, it seems to pay off.
Search engine statistics
- What do you do first of all when looking for some information? You Google it, and so do most of us. So, it is not all that surprising that 68% of all online experiences begin with search engines.
- The previous data is not convincing enough for you to invest in your search traffic optimization? Here is one more fact: 39% of all purchases are influenced by a relevant online search. This is one more reason to make sure your brand is represented online.
- Why is it so essential to get on Google’s first page? Actually, 75% of Internet users never scroll past the first page of their Google search results, so proper SEO might be your only chance to get noticed by ¾ of your potential clients.
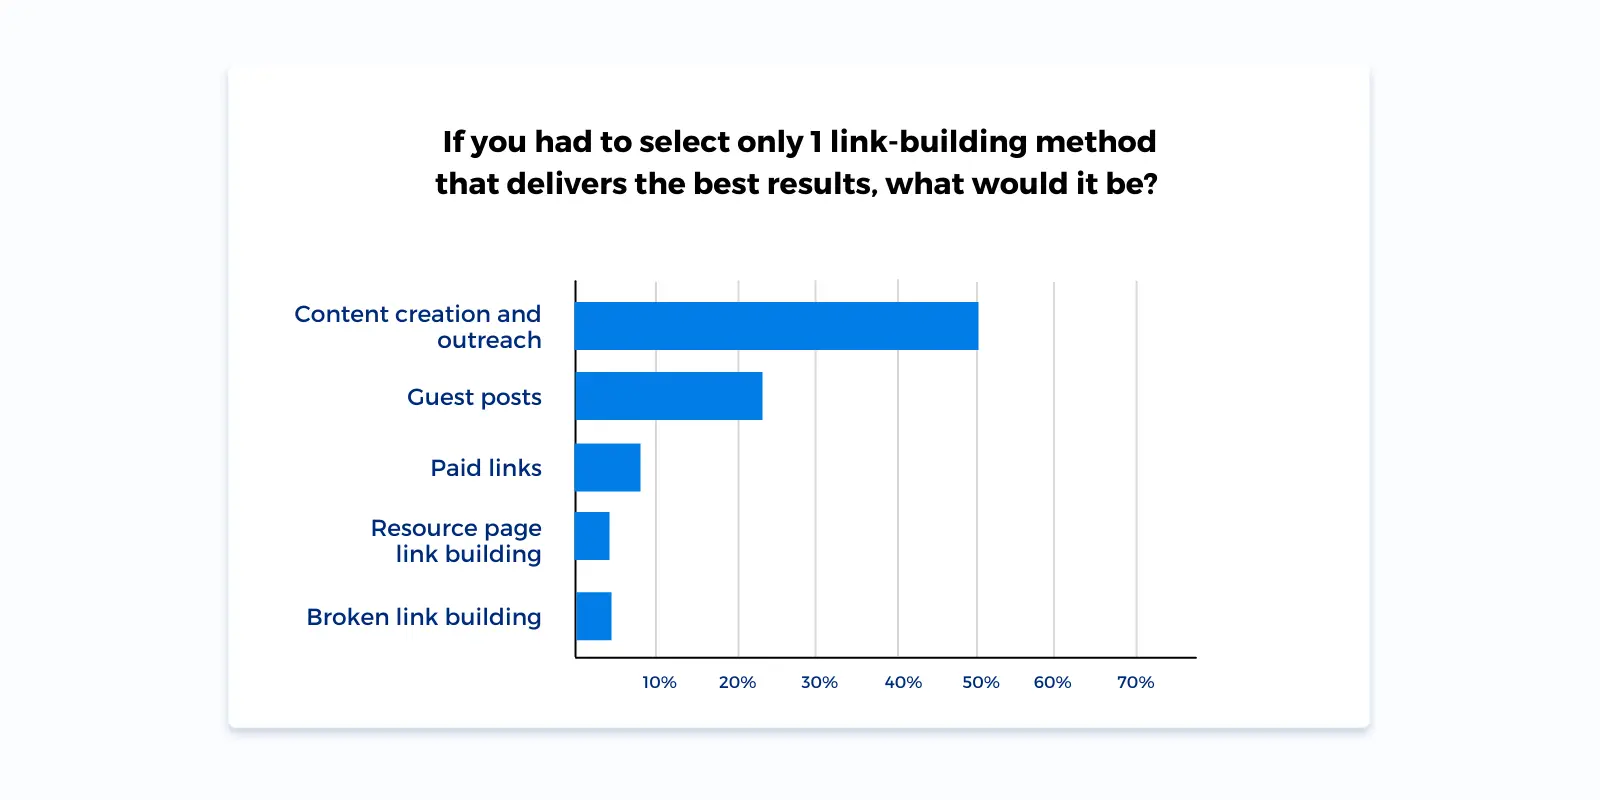
- Wondering which link-building method is the most effective? When asked to choose one only, 50% of specialists said they would opt for content creation and outreach.
- Google gets around 100 000 searches. Every day? Or every hour? Every second! This number shows how many people actually turn to Google when it comes to looking up some information.
- 68% of all web traffic comes down to a combination of two tactics: paid and organic search. So, if you are hesitant about which strategy to choose, the best idea might be to use them both.
- At the same time, 70-80% of users decide not to view the paid search results and move on to the organic ones right away.
- Why is being in the top three search results so crucial for a business? The truth is that those three top pages earn 50% of all clicks, so marketers aim for the top position for a reason.
- SEO or PPC? This ultimate debate can be ended in just a minute: 70% of marketers find SEO more effective than PPC.
- Finally, time to remind you about the importance of mobile optimization as now around 25% of companies call it their top SEO strategy and choose to invest in it.
Mobile marketing statistics
- 13, 5% of the companies’ marketing budgets are put into mobile ads.
- In 2024, Android is still prevailing in the global market, taking up 71.85% of all mobile devices.

- What is the most used mobile app? Maybe Instagram or Facebook? Wrong! 76% of people use the Internet browsers on their phones the most. We all need to Google something and sometimes don’t even remember about that!
- Are mobile ads annoying for users? Yes, to a certain extent. Still, 59% of people report that they are okay with the online advertising on their smartphones as much as they are with those on the TV.
- The previous data shows that there is a point in investing in a mobile ad for your company. But how many business owners do it? Around half of them: 51%.
- Mobile devices account for around 53% of paid-search clicks. This data once again proves that people use their phones as much, if not more, as computers, so it is crucial to create an effective strategy for both.
- How much time do the users spend on their phones every day? According to the studies, an average American dedicates around 5.4 hours to their phone a day. So there is plenty of time for you to get in touch with your potential customers!
- As the previous stats show us, we spend a lot of time on our phones. But guess what? It will only get more! The forecasts say that mobile data traffic is expected to increase by 25% from the current levels.
- By now, it is clear that at least half of the people are using their phones for getting some information or just browsing the Internet. But what about making purchases? The number goes up to as much as 80%! Yes, 80% of users buy stuff online using their smartphones. So make sure your website works perfectly from any device!
- Around 90% of mobile users have not yet selected the brand when performing an online search. What does it mean for you? It is a massive space for showcasing why they should choose your brand, so be sure to list all the advantages on your website or social media profile.
Content marketing statistics
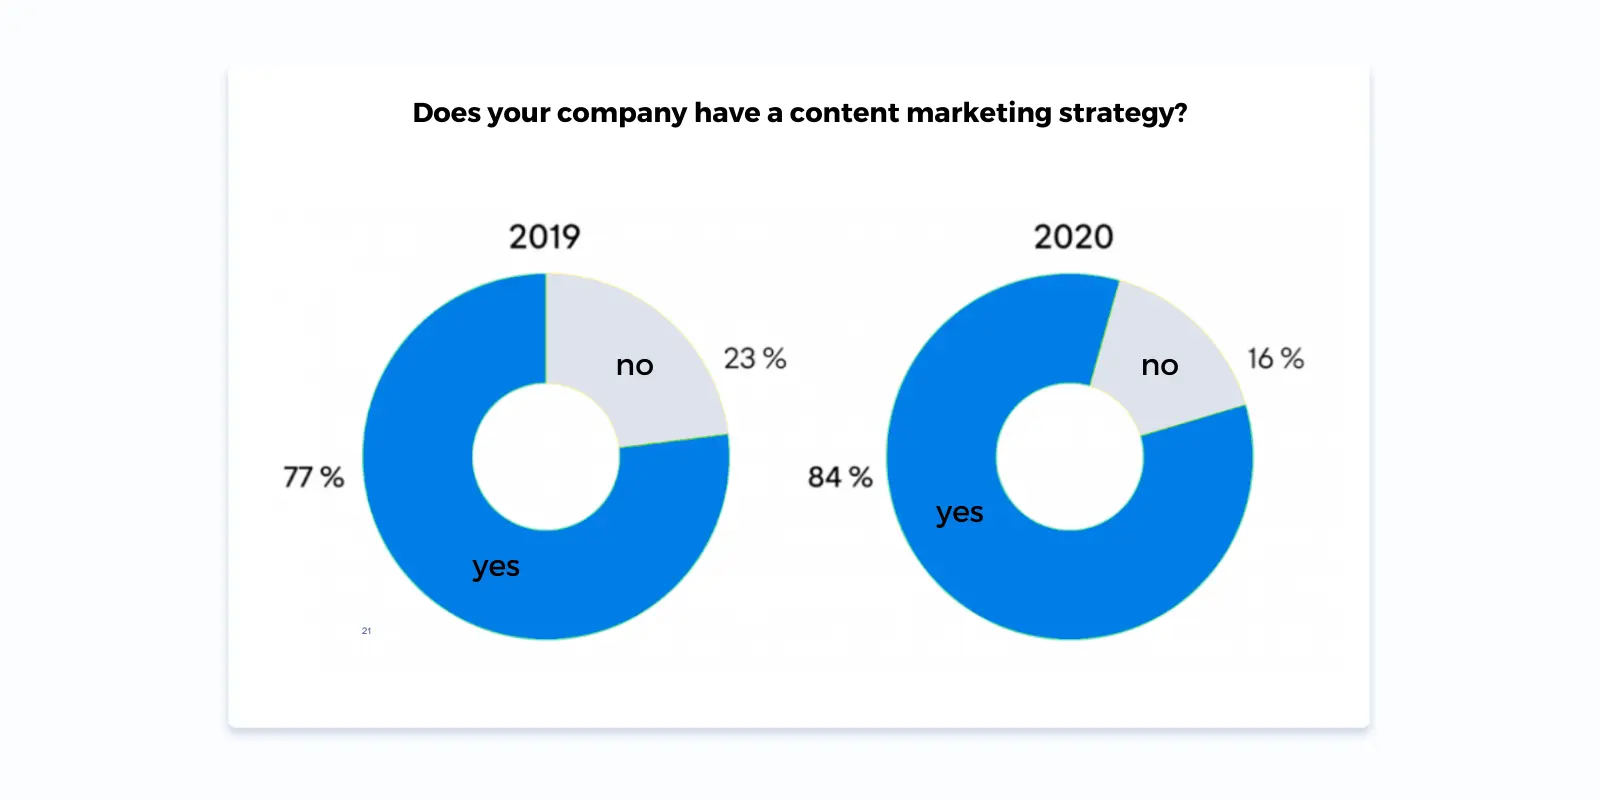
- 77% of companies have a content marketing strategy. So, it is one more reminder that having a blog and generally taking care of your content is paramount for a successful digital marketing strategy.
- 61% of customers have bought a product they were recommended in a blog post. This data proves that people see blogs as trustworthy sources of information.
- How important is blogging for a company? Maybe it is too much effort spent on nothing? No, the statistics demonstrate the opposite. Companies with active blogs usually get 55% more website visitors than those who don’t.
- Are there some more benefits to content marketing except for more website visitors? Of course! 75% of marketers share that they are using blogging as a tool for building trust. It is a good strategy indeed: showing your expertise in the articles makes you more reliable in the eyes of the readers and potential customers.
- What about the most effective ways to approach content marketing? 75% of the marketing teams reported that SEO was their most efficient implemented tactic in 2021. Your content should be helpful for the readers, but as this data shows us, it is paramount to make it discoverable through SEO.
- What are the most commonly used types of content? Videos and texts! 64% of marketers say that they create various videos, such as webinars, and 61% publish blog posts and eBooks.
- Okay, now we know that written content is a way to go. But how long should your articles be? On average, a successful blog post reaching the top of the results page is 1447 words long.
- How often is it best to publish your content so it’s not too much or too little? The recent data shows that if your goal is some organic traffic, 3-5 posts a week is a perfect number. It is essential to be consistent and appear online regularly. Seeing that some company posted some weeks ago is not telling us that they are open to new clients.
- Let’s suppose that you created a handy piece of content: easy to read with lots of relevant information to help your clients. You publish, and that’s it; no one views it. How do you promote your post? According to the statistics, 72% of marketers use paid social media posts and advertisements to get more people to read the article. Maybe you should give it a shot too?
- To finish up with our content marketing statistics, let’s talk about the results it brings to the companies. On average, companies that take care of their blogs receive 67% more monthly leads as compared to those that don’t have a blog. Quite inspiring, isn’t it?
Email marketing statistics
- On average, email marketing has a 4400% ROI. Sounds just crazy, right? It means that every dollar you are willing to invest in your email campaign will likely bring you $44 of revenue. It’s a fact: email marketing is one of the most cost-effective ways to promote your business online.
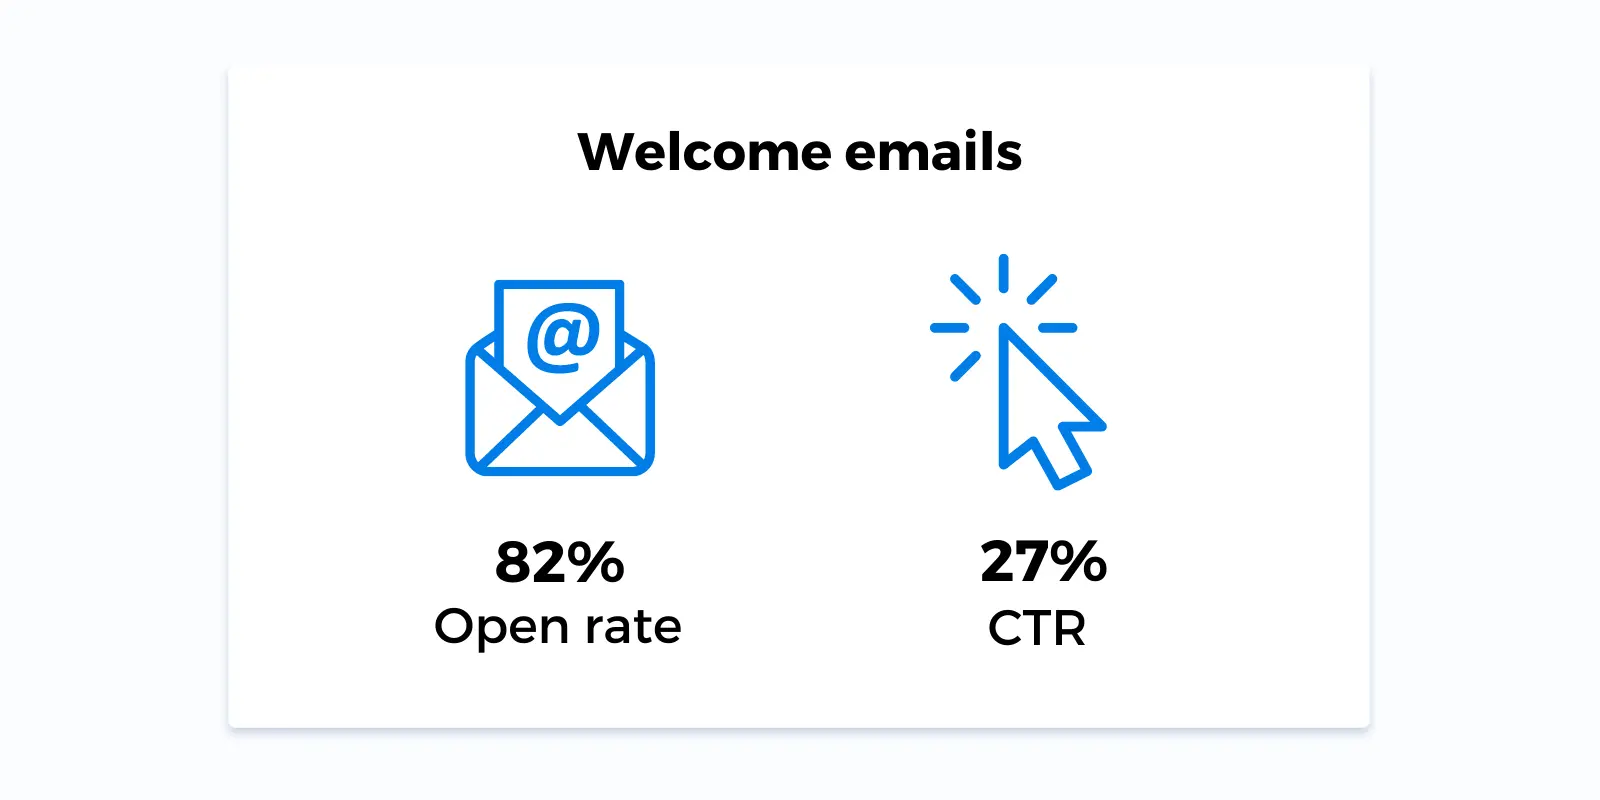
- Do you know what the average welcome email open rate is? 82%! So, for those who think there is no point in sending such letters: this statement is wrong. A welcome email is a great way to greet your new clients and, at the same time, improve your conversion rates. Adding a professional touch with an email signatures generator can further enhance your brand presence in these initial interactions.
- 21% of emails are opened within the first hour after they were sent. What does this mean for your email marketing strategy? Add calls to action! Almost one-fourth of people read their emails right after getting them, so you can be sure that they might as well follow the link or download a file.
- Please add videos to your emails! Just do it: such a simple action can increase your click rates by 300%. Not everyone is into reading texts, so watching a video is a way more straightforward and, let’s face it, a fun way to get the information. So, be sure to spend some extra time filming an excellent video to get better email marketing results!
- Did you know that around half of the emails are opened from smartphones? 49% of the letters you send will likely be viewed on the mobile screen. So, yes, we will repeat it again: responsiveness, responsiveness, responsiveness. Everyone hates emails with cut pictures and broken links, so make sure that your email looks perfect on any device.
- Thinking that newsletters can be a waste of time and no one reads them? Almost half of the users (49%, to be exact) stated that they want to receive newsletters from their favorite brands.
- We discussed the customer’s preferences, but what do the small business owners have to say? Well, they like the email automation tools. 50% of small and medium business owners use such tools.
- Don’t forget to take care of the subject line of your email. According to one company’s individual research, 33% of the receivers judge the email by its subject line. So yes, it’s better to make it catchy.
- 60% of customers are willing to subscribe to your email to get some deals and promotions. Offering your leads a good discount or a gift can be a great motivation for them to read your new letters.
- Unsure how to format your email? Think about pictures. Two-third of surveyed people reported that they prefer letters mainly consisting of visual materials. Try to make it vivid and easy to read, so the receivers can instantly grasp the most important points of your message.
What does it all say to us?
Wow, that was a lot of numbers! Why is it important to know all of them? Because they show what works and what doesn’t. Let’s be honest; making blind guesses can cost you a lot of time and money wasted on an ineffective strategy. You can’t create a working strategy without knowing what you are doing and, more importantly, why.
Instead, you can learn how others do it, what the customers like and dislike, and all the current marketing trends. Try to take all this knowledge and put it to good use.
So many studies are done by companies every year for a good reason: they research all this data, first of all, for themselves, and are happy to share the results with others. Thanks to such studies it is easy to find out whether, for example, adding visuals to your content is a good strategy or just a waste of time. Make a digital marketing strategy based on reliable data, and it will work: we promise.

