
Vital Important KPIs to Track as a Small Business
1. What is KPI metrics?
2. Why you need to measure KPI to manage your small business
3. KPI examples and types for small business
4. How to identify what key areas to measure to improve your business
5. How to monitor KPI
6. KPI dashboard templates
Useful tools:
1. Newoldstamp - Email signature marketing
2. Mailchimp - Email builder and sender
3. SEMrush - SEO research and audit tool
4. Mailtrack - Email link opens tracking
5. Canva - Online tool for making designs
Whether you are a small business owner or a director of a multinational corporation, KPIs should be something to focus your attention on. They help you to keep track of your company’s financial and organizational well-being, as well as the effectiveness of your activities. Without monitoring KPIs, you cannot effectively manage the business of yours. This is why we have prepared an overview of some of the KPIs you should consider monitoring and explained how you can do it.
via GIPHY
Let us start with the basics.
What is KPI metrics?
KPIs or Key Performance Indicators let you determine how well your company has reached its business goals.

KPIs are often a number, sum, or a percentage. In other words, a KPI is a measurable value that tells you how your business is performing.
What can and should be measured is a completely different question. A simple answer: everything. A more accurate one: your company’s performance or progress in reaching its goals. What is measured here is determined by your business’ long- and short-term objectives. And it is for you to decide whether it is increasing profits or gaining more newsletter subscribers.
Let us see why monitoring KPIs is that important.
Why you need to measure KPI to manage your small business
A 2016 survey found that small to medium-sized businesses that keep track of their KPI metrics are twice as likely to meet their targets. Let us see what the benefits of monitoring KPIs are and why you should care about them.
- KPIs allow you to track performance in various areas of your business.
- Analyzing KPIs helps you to know what’s working and what’s not.
- As a result, this helps to prioritize those activities that bring in the highest revenue and eliminate those that are not worth your efforts.
- You can save costs by adjusting your strategy by focusing on the channels and activities with the best performing KPIs.
- Tracking KPIs will enable you to make prognoses regarding the profits and gains.
- Monitoring KPIs and comparing them to the set goals will help you manage your expectations better.
- Seeing how your small business performs in various areas will help you plan improvements and implement innovations more precisely and effectively.
Below we will tell you more about what can be measured and KPI examples that your business could use.
KPI examples and types for small business
There are hundreds of KPIs that small business owners and heads of departments might want to focus on. To help categorize them, let us look at 4 groups of key performance indicators for small and medium businesses.
Operational KPIs
These KPIs for small businesses help you to assess your operations. What does your company do and how effectively does it do that to reach its business goals? How much of your production capacity you are using? How effective are your employees in generating revenue? How fast do you sell your inventory? We have overviewed three universal operational KPIs below, Revenue Per Employee, Inventory Turns, and Staff Turnover.
-
Revenue Per Employee (€/$)
Include this KPI in business reports if you want to know how efficient your employees are. When the revenue you are making is smaller than the amount of money you spend on keeping people in the company, then you are probably overstaffed.

-
Inventory Turns (n)
Inventory Turns stands for an average of times the inventory is being sold over a certain period of time (for example, one year). This KPI allows you to make sure that the goods you are producing are not accumulated without use. The value of this KPI may vary from industry to industry, as Inventory Turns of a plane manufacturer will be different from those of a grocery store.

(Average Inventory means the average between the Inventory costs at the start of the year and Inventory costs at the end of the year.)
-
Staff Turnover (%)
Staff Turnover is the percentage of employees who left your company within a particular period of time. People are leaving companies for a variety of reasons, including their dissatisfaction with working conditions, company culture, and management. Utilizing performance management tools can provide valuable insights and strategies to enhance employee satisfaction. It is often best to do everything possible to minimize the Staff Turnover, as hiring new employees can in the long run cost more than taking measures to prevent employee departures.

Financial KPIs
Financial KPIs help you to determine whether your company’s financial goals have been met. In other words, financial KPIs measure the financial success of your business. Net Profit, Cash Flow, and ROIC are a few examples.
-
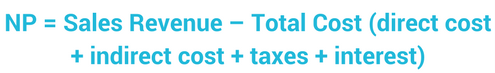
Net Profit (€/$)
This KPI helps you to answer one simple—yet most important—question: are you making money with your business? Also called net income or net earnings, it is probably the primary KPI business owners are interested in.
-
Cash Flow (€/$)
Cash flow is the amount of money that is moving into and out of your business.
It is calculated by subtracting the total amount of company’s payments from the total amount of its cash receipts. Cash flow can be positive or negative. Positive cash flow often means that a company is capable of maintaining itself financially.
![]()
-
Return of Invested Capital (%)
It helps you understand how much profit is generated from all the capital investments. In other words, this KPI shows how effectively you are using your investments to generate profit. A healthy ROIC is considered to be at 15% or more.
The simplified formula is:

Growth KPIs
Growth KPIs focus on measuring change (growth) in numbers or percents over time. It can be related to just about anything, from your overall revenue to the number of new customers on your website. We’ve chosen Revenue Growth Rate, Sales Growth, and New Leads Generated to view in more detail below.
-
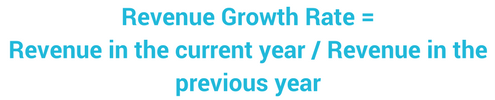
Revenue Growth Rate (%)
As the name suggests, Revenue Growth Rate indicates the rate at which the company’s revenue grows over a certain period of time (usually a year). It is measured in percents.
-
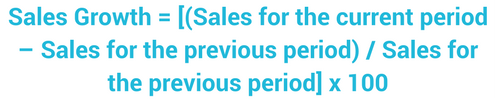
Sales Growth (%)
Sales Growth is the pace at which the company’s sales revenue is increasing. It is advised to monitor this KPI not only yearly, but over shorter periods of time (namely, quarterly and monthly). This will help your organization determine growth trends, as well as understand which times are best for purchases and investments.
-
Lead Generation (New Leads Generated) (n)
This KPI shows the number of new leads that have been generated over a certain period of time. It helps your business to evaluate the effectiveness of a given marketing campaign.

Customer KPIs
These KPIs are related to your customers and their relationship with your business or your product. It can be everything from customer satisfaction (which you can measure with the help of surveys) to their lifetime value. A few examples of customer KPIs are viewed below: CAC, CRR, LTV, and CR.
-
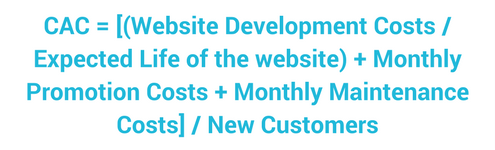
Customer Acquisition Cost (€/$)
It refers to the amount of money that you need to invest in order to acquire one paying customer. You will need this KPI to determine the future cost of your marketing campaigns, as well as their effectiveness.
The formula for this KPI may differ from company to company. It will depend on what kind of customer acquisition channels you use and what kind of investments you need to make to attract customers. In case of website acquisition, the formula looks as follows:
Along with tracking KPIs like CAC, using a professional email signature can support your brand’s marketing efforts. A well-designed signature with links to your website or key content enhances brand consistency and keeps your business top-of-mind with every email sen
-
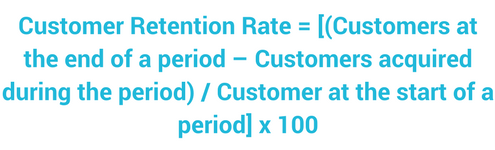
Customer Retention Rate (%)
Customer Retention Rate is the percentage of the customers that your business has managed to keep during a particular period of time. Normally, the business should be interested in keeping the CRR as high as possible.
-
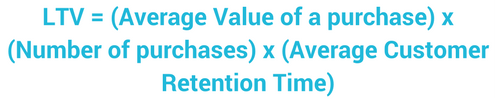
Lifetime Value (€/$)
This is one of the most important customer KPIs for your business. Customer’s Lifetime Value shows the gross profit that your company generates from a single customer during the entire time that the customer buys company’s products or services. There are different ways to calculate the LTV. Below is the simplest formula:
-
Conversion Rate (%)
In simple words, Conversion Rate is the percentage of your visitors (or people who interact with your brand) that became your customers. High Conversion Rates mean that people love your product and they are likely to use it after having learned about it. The formula is very simple:

How to identify what key areas to measure to improve your business
Each business has its own specifics. They depend on what your product is and how you promote and distribute it. Important is that you have your own expenses on maintaining your business and the revenue you get from your customers. It is also essential to combine KPIs in various areas and track them regularly over certain periods of time.
Probably the main questions you need to ask yourself when identifying the most important KPIs are:
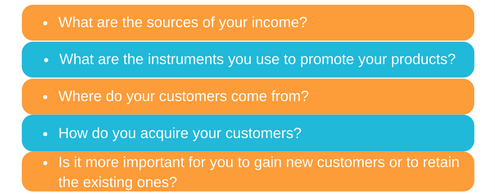
If you are a business with an online digital product for other companies, then you should probably focus on raising awareness about your brand (through promotion), but, most importantly, on keeping the existing customers. In this case, for example, Customer Acquisition Cost, Retention Rate, and Customer Lifetime Value will play a great role. Consequently, if your Customer Acquisition Cost is greater than the Customer’s Lifetime Value, then you are spending more money on each customer than generating from their purchases.
How to monitor KPI
In order for your business to be successful, you should monitor KPI and analyze them regularly. Below is a KPI monitoring checklist for you:
- Define an area for a specific KPI
- Write KPI goals for the selected metrics
- Make it known to your employees
- Track the KPI on a regular basis (for example, monthly)
- Compare the results with your set objectives
- Check whether the set KPI is actionable
- Update your KPI if needed to fit the realistic expectations
- Revise your KPIs as your business grows
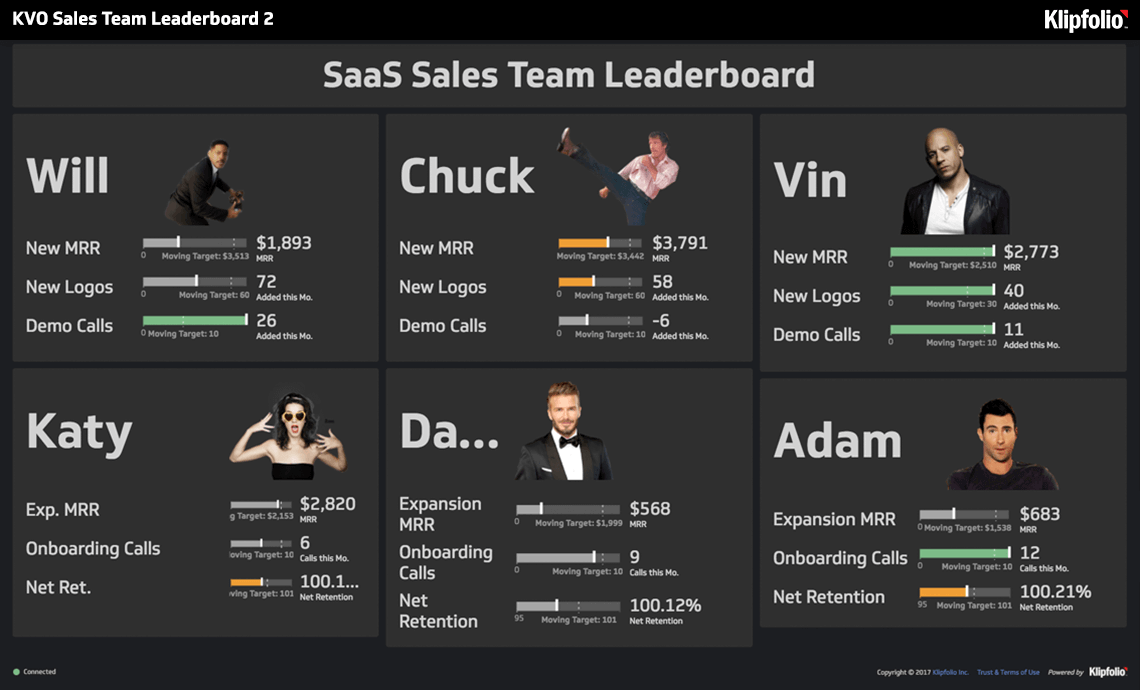
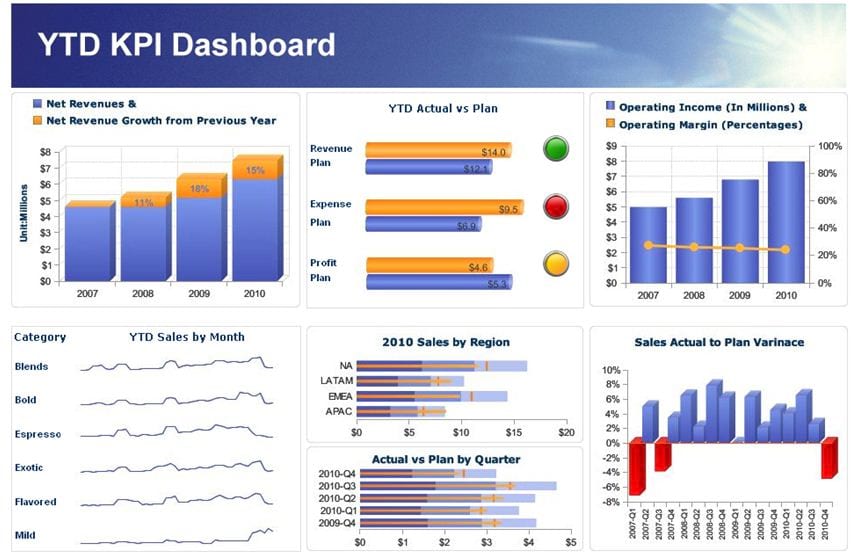
One of the best ways to monitor your KPIs is to create customized KPI dashboards. More on this below.
KPI dashboard templates
To be most efficient and get the most use from your KPIs, it is recommended that you monitor them in real time to see how they change. If you fail to do that, it is possible that you miss some important trends (for example, you might overlook a significant drop in email open rates during weekends if you are paying attention to only weekly reports).
Of course, it is almost impossible to keep track of everything that happens in the stats across different platforms and channels. However, you can set up a number of KPI dashboards where you could track your real-time KPI performance.
Every digital marketing tool offers you some sort of analytics which comes with a custom dashboard. Social media channels like Facebook, Twitter, LinkedIn, or Instagram all have this feature. If you are using tools like Hootsuite or Buffer, it is easy to combine stats across different channels into a single dashboard.
Google Analytics, a powerful marketing analytics tool, lets you set up a customized dashboard. In it you can include all key performance indicators that matter to you, including numbers of new visitors, retention rates, acquisition costs, etc. The best thing is that you choose your KPIs yourself and keep track of them in one place.
via Jinfonet
There is a number of online services where you can take a look at some KPI dashboards and set up your own ones (of course, for money). You can check out Klipfolio for more details on many a KPI dashboard template for your real-time KPI reporting: https://www.klipfolio.com/resources/dashboard-examples/
Summary
KPIs are essential metrics to keep track of to monitor and improve your business performance. Use KPIs to see how effectively you reach your goals, what instruments are the most efficient, and what activities are generating the most revenue.
Every small business owner decides which KPIs are “key” to there company. However, it is important to monitor KPIs in different areas: operational, financial, growth, and customer KPIs. If you are a marketing director, the KPIs essential for you can be found in all of the four groups.
Just be sure that you can monitor KPIs in real-time, to ensure that you don’t miss important performance trends and productivity changes. Use customized dashboards that you can create either with Google Analytics or any of the software applications, free or paid to see how your business is performing.

